Table of Contents
1. What are KPIs?
![]() School districts routinely analyze academic data to inform their strategy for student growth and achievement. Common analysis practices such as measuring cohort results and benchmarking against peer groups are employed at regular intervals to identify strengths in a district’s instructional programming and develop plans to address gaps. The impact of data-driven decision making is powerful. Analyzing academic performance data has played a significant part in increasing student performance in many states across the nation.
School districts routinely analyze academic data to inform their strategy for student growth and achievement. Common analysis practices such as measuring cohort results and benchmarking against peer groups are employed at regular intervals to identify strengths in a district’s instructional programming and develop plans to address gaps. The impact of data-driven decision making is powerful. Analyzing academic performance data has played a significant part in increasing student performance in many states across the nation.
This approach is paying off for district business and operations leaders. Some are finding that measuring and analyzing performance of district operations can also have an impact on student achievement and can help create a high-performing, efficiently operating district. A focus on analyzing proven Key Performance Indicators (KPIs) in areas such as transportation, food services, maintenance, and business services departments across the district is proving to be pivotal in meeting the mission to cut costs and positively impact student outcomes.
“There are many indirect relationships,” said Jeff King, the Chief Operating Officer at Illinois School District U-46. “If the students have a bad experience on the bus in the morning that could impact their day in a negative fashion. If they do not like the food we serve, their hunger may be a distraction. If the building is too hot or cold, it could create an environment that is not conducive to learning.”
The challenge most district operations leaders face when beginning to analyze and benchmark KPIs against peer cohorts is where to start. Any given department in a school district can perform hundreds of tasks on a daily basis, which makes selecting the right performance metrics to measure challenging when starting from scratch. After collecting and recording individual performance, districts often have no resources to benchmark their data against, which leaves them with the question: “Where are my strengths and weaknesses?”.
To address these obstacles in district operations, the Council of Great City Schools (CGCS) created a framework for measurement and analysis to help district business leaders think strategically about how to improve processes, conserve resources and impact student achievement. The ActPoint KPI project began in 2004 with TransACT Communications with five goals:
- Establish a common set of non-instructional KPIs which a district anywhere in the nation could
use - Allow a district to benchmark performance on these key performance indicators
- Identify and document effective management practices of the top-performing districts to improve
their operations - Automate performance data in a way that allows districts to improve resource deployment and
decision making over time - Develop standards of excellence on each of the indicators
The Council of Great City Schools has identified Key Performance Indicators that conserve resources and impact student achievement for operations leaders across the district:
Finance:
- Accounts Payable
- Cash Management (Treasury)
- Payroll
- Financial Management
- Grants Management
- Procurement
- Risk Management
Operations:
- Food Services
- Maintenance & Operations
- Safety & Security
- Transportation
Human Resources:
- Teacher Retention – Average for Years 1-5
- Teacher Absences per Teacher
- Employee Separation Rate
Information Technology:
- IT Spending per Student
- Average Age of Computers
- Mean Time to Resolve Tickets
“We invented what is now a full-fledged national performance management system for urban schools across the country,” said Dr. Michael Casserly, Executive Director of the Council of the Great City Schools. “The Council of the Great City Schools saw a major need to provide a tool which would allow our members to find the lowest cost and highest service level providers on the non-instructional side. The metrics we created and the data analysis tools which followed filled this gap.” ActPoint KPI is an online data and resource center that allows districts across the nation, regardless of location, to access guidance and performance information on key performance indicators, as well as visually manage their own performance.
![]() To meet the primary challenge of creating KPIs that are impactful in an individual department but measurable across the country, CGCS formed technical teams to vet proposed KPIs, and then applied six-sigma methodology to define them. After several rounds of testing and adjusting, CGCS identified over 500 KPIs that school business and operations professionals can use to measure, compare and manage their performance effectively.
To meet the primary challenge of creating KPIs that are impactful in an individual department but measurable across the country, CGCS formed technical teams to vet proposed KPIs, and then applied six-sigma methodology to define them. After several rounds of testing and adjusting, CGCS identified over 500 KPIs that school business and operations professionals can use to measure, compare and manage their performance effectively.
CGCS recommends a framework for analyzing data in an operational program that is very similar to what districts routinely employ for instructional programs.
Step 1: Measure Your Results
Record performance on KPIs in the current year, as well as previous years. At least three years of historical trend data is optimal when comparing annual data.
Step 2: Compare Your Results
Gather the performance of peer districts (for example, by student size, geography or poverty rate). The search can be local, state-wide, or national because school districts across the country face similar problems, regardless of proximity to each other. Using comparative performance data enables districts to identify peers who have already solved a problem they might be experiencing, and to learn from their process.
Step 3: Manage for Results
Use the peer-to-peer data to identify places where the district has strengths and weaknesses. Leaders can then collaborate to identify areas that, if improved, will make the biggest impact on the short and long term goals for the district, and set transparent goals around performance so that employees have a clear, measurable result to achieve each year. An important aspect of this step is to not “set it and forget it”: engage in routine performance analysis to measure the progress towards transparent goals, and adjust course along the way.
2. KPIs by Department
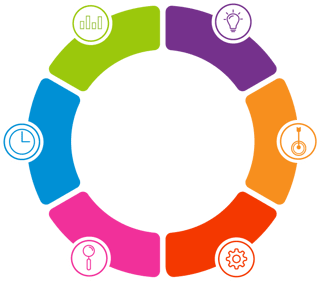
With over 500 metrics spread across 13 different functional areas, the question of where to begin looms large for districts that do not currently have a KPI program. After developing KPIs for each department, CGCS and its task force then split them into three tiers that help districts determine how and when to use each type:
It is important to know that it isn’t necessary to begin with all 500 KPIs to have an enormous benefit on your district. When building an analytics practice, selecting a few Power Indicators will give you a strong indication of where you need more information in your district. After getting started, you can drill down into Key Indicators to find out where to optimize.
Food Services, Payroll, Transportation, and Building Maintenance and Operations have each proven to be strong functional areas to begin a KPI program because optimization in these departments can have a direct impact on student achievement or create significant cost-savings.
Measuring performance and using data to manage performance is one of the ingredients to success at U-46. "It allows us to convey our success to our customers/public and to show that we are a high-quality organization,” said Jeff King, Chief Operations Officer of Illinois School District U-46. “It also is a basis to reflect on areas of need and what actions we can pursue to improve our customer experience and provide the positive support necessary for academic success."
Food Services
"With key indicator information available in a timely fashion, the department can quickly implement programmatic adjustments such as menu changes, staffing adjustments and modify equipment purchasing decisions.” - Jean Ronnei, Senior Consultant, Pro-Team Foodservice Advisors and former Chief Operating Officer at Saint Paul Public Schools and Former President of the National Nutrition Association
According to a study by the Centers for Disease Control, student participation in school breakfast programs is correlated with increased academic grades and standardized test scores. Well-fed students have sustained energy which can have a direct impact on their ability to learn.
“A hungry child cannot learn. None of us perform at our best when hungry,” said Jean Ronnei, former Chief Operating Officer at Saint Paul Public Schools. Ms. Ronnei is the past President of the National School Nutrition Association. She started her career in the food service department as a director and now works with many school districts nationwide as a senior consultant for Pro-Team Foodservice Advisors.
Ms. Ronnei recommends, at a minimum, to track the following metrics monthly, quarterly and yearly:
- Food cost (commodities)
- Labor cost (benefits, worker's compensation, taxes, leave pay, temp costs)
- Supply costs
- Equipment costs
- Indirects (chargebacks, leases/rent, fees, dues, travel, repairs, etc.)
- Participation by meal category and grade grouping (adjusted for variables such as enrollment, attendance factor and # of school days)
- Fund Balance
- Meals per Labor Hour (MPLH)
- Inventory by site
Payroll
The payroll department offers an area where creating streamlined processes and automation can reduce costs. Smaller districts with limited options to choose from when it comes to making staffing changes find that business services department, the payroll, accounts payable and purchasing departments are all functions where savings can be found if labor costs are fixed. That savings can be translated to dollars which can go back into the classroom.
Districts can determine how efficient their payroll department is by seeing how they compare to other districts on metrics like cost per paycheck and paycheck processed per FTE.
KPIs to Benchmark in Payroll:
- Cost per paycheck
- Paychecks processed per FTE per month
- Paychecks deposited via direct deposit
- Paychecks processed off-cycle
After identifying their performance, districts who learn from their peers find that a high number of off-cycle payments leads to higher costs when a check has to be manually created and issued. This leads to reduced efficiency as payroll staff has to spend more time creating the checks. Some of these issues can be avoided if checks are deposited electronically and processes are put into place to ensure payroll information is entered accurately. Making process adjustments like these reduce the need for a higher headcount in payroll departments and can preserve resources for the classroom.
Transportation
Transportation analytics are unique in that they provide the additional benefit of being able to effectively prove the need for more resources to the public. For example, it is generally recognized that younger fleets are less costly and more reliable, but it can be difficult to advocate for the enormous cost of a new fleet on a levee without performance data that shows exactly how an older fleet impacts costs or student outcomes.
Other metrics can help districts point to problem areas that are difficult to quantify anecdotally. One of the factors that can prevent efficient transportation is having too few bus drivers, but the most effective response to this information might not be to simply hire more drivers. Many districts face bus driver shortages and find it difficult to train and retain quality bus drivers, all of which impacts reliability, safety and costs. Tracking turnover ratio and how long it takes to fill a bus driver position can help a district analyze root causes and implement innovative retention strategies like providing a training program for perspective job candidates or tutoring to pass required tests. Other districts have provided shirts with district logos to ensure that drivers feel like they are part of the district and included in district culture.

KPIs to Benchmark in Transportation:
- On-time performance
- Cost per rider
- Miles between preventable accidents
- Live miles per deadhead miles (miles driven to get to or from a route)
Maintenance and Operations
Studies have shown that cleaner facilities positively impact student outcomes. According to a study by the Council of Great City Schools (CGCS), students in deteriorating school buildings score between 5 to11 percentile points lower on standardized achievement tests than students in modern buildings. In fact, extended maintenance work order completion time potentially correlates to psychological or practical effects on students, including students feeling undervalued or unable to use certain equipment or technology effectively.

Despite the significant impact on student growth and achievement, Maintenance and Operations is often one of the first departments to face cuts when the district is facing challenges. However, making cuts without data can lead to or continue to propagate uneven custodial workloads between buildings and waste resources on poor service levels. Several KPIs can help leaders who are facing budget cuts identify places to reduce costs while preserving service levels. Some of the most common indicators are:
- Custodial workload (districtwide as well as by site)
- Work order completion time and rate
- Supply costs
- Worker turnover ratios as well as time-to-fill vacancies
Maintenance and Operations data provide substantial opportunity for cutting costs. Leaders can see where they have a variance in custodial workloads across sites, shift resources to handle an influx of work orders, and find cost-savings by comparing the amount of money spent on common supplies. This creates cleaner learning environments at a lower cost, ultimately allowing operations departments to demonstrate preserved service levels across school sites while meeting or beating the budget reduction goals.
3. What happens when districts manage their operations through KPI analysis?
"Key Performance Indicators: From Promise to Payoff”, a report published by the George Bush Institute, reported that districts using ActPoint KPI and the CGCS framework for analysis have saved their districts millions of dollars and improved services levels."
| Reported Changes | Reported Results |
|
Used the "sunshine" from the KPIs on cost-per-student metrics to negotiate lower contract costs |
Saved at least $40,000 |
| Used the KPIs as a method to assess and validate staffing requirements |
Saved $500,000 in labor |
| Changed IT policies and practices | Improved IT service delivered to district |
| Optimized transportation | Saved millions |
The results of setting strategy using performance data in district operations are inspiring: given a focused effort on measuring performance on a few key indicators and time to implement targeted best practices that can be learned from peer districts, business and operations leaders can confidently ensure their resources are contributing to student growth and achievement. Secondarily, performance analysis makes advocating for more resources from the public easier, and helps demonstrate a return on investment. As districts work under the reality of the new political environment, measuring performance and using KPIs to reach both these goals could have even greater importance.
“Earlier this year, a senior White House advisor to the President indicated that part of the new administration’s goal was to ‘infuse levels of accountability, metrics, and deliverables’ into a system that lacked all three,” said Dr. Casserly in 2017. “With our KPI system, the nation’s urban public schools are ahead of you on all three.”
About the Author
Phillip leads the ActPoint KPI team and leverages his extensive software and education industry experience to build innovative solutions for many of TransACT's educational industry customers and partners. Phillip also leads the ActPoint KPI and Council of Great City Schools (CGCS) partnership to enable school business and operations leaders to track and compare non-academic metrics with the goal of continuous improvement. Since its launch, ActPointKPI has supported 100s of school business leaders nationwide in their quest to reduce costs and drive resources to where they are needed most: the classroom.

Download Key Performance Indicators
in District Operations
With over 500 metrics spread across 13 different functional areas, the question of where to begin looms large for districts that do not currently have a KPI program. Use this guide to learn more about how to begin a KPI program in your district.


