- Solutions
- Products
- Events
- Resource Center
- About Us

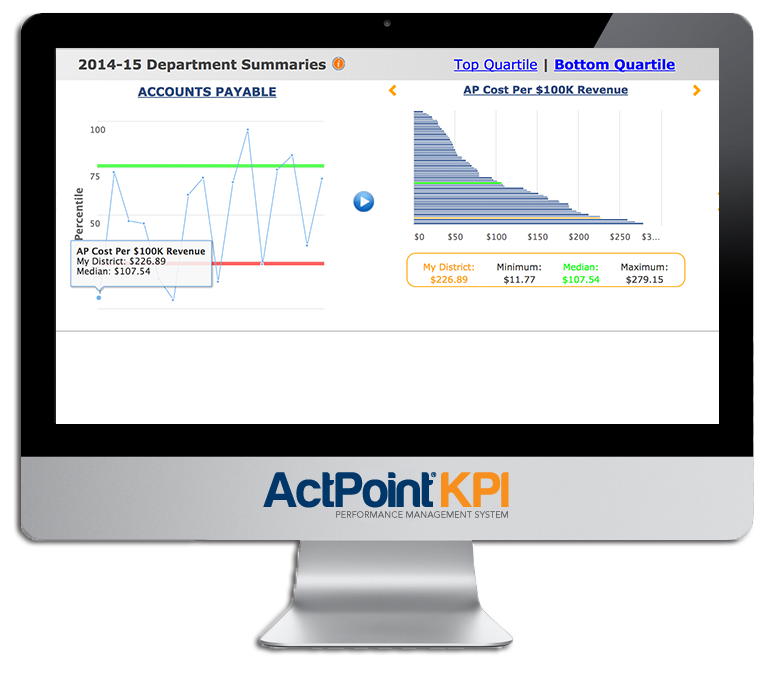
ActPoint KPI is only available to existing ActPoint KPI customers.


Guided by a team with an extensive background in ESEA (NCLB/ESSA) compliance leadership, K-12 education services, and management experience at Fortune 100 companies, we provide thousands of K-12 organizations with software and expertise to manage federal and state-level compliance, communication, and operations more efficiently.

©2025 TransAct Communications, LLC. All Rights Reserved. TransAct®, EduPortal®, ActPoint®, The Right Step Now.®, Confidence in Action® and Achieve Compliance with Confidence® are registered trademarks of TransAct Communications, LLC.
